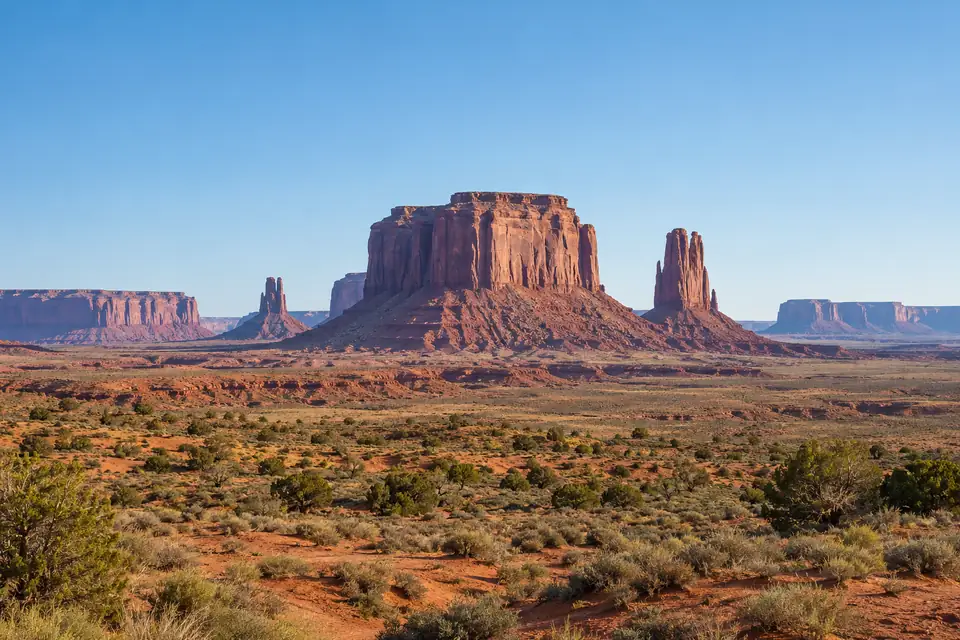
McCall, Idaho
McCall, ID weather history and record highs today
Weather, monthly averages and records.
: 2026 so far brought 16.03 in of precipitation in McCall, ID, the driest 1 January to 20 November since 2008, 11th driest of 96.

Weather in McCall
- High
- 35°F
- Coldest since 2022
- 35th coldest of 108
- Low
- 27°F
- Warmest since 2025
- 31st warmest of 111
No measurable precipitation in McCall, ID for 1 day to Friday 20 November 2026.
How does the day compare with the average?
The high of 35°F on Friday 20 November 2026 in McCall, ID was 3.3°F below the average high for the date (38.3°F), colder than 65 of every 100 days at this time of year (1991 to 2020). The low of 27°F on Friday 20 November 2026 in McCall, ID was 6.3°F above the average low for the date (20.7°F), warmer than 72 of every 100 nights at this time of year (1991 to 2020).
The average 20 November in McCall, ID (1991 to 2020): a high of 38.3°F, and eight years in ten between 28.6°F and 48°F; a low of 20.7°F, and eight years in ten between 8.4°F and 32°F.
A high of 35°F or less on 20 November has happened in 41 of 108 years at the McCall, ID station, 2026 included; the last time before 2026 was 2022. A low of 27°F or more on 20 November has happened in 34 of 111 years at the McCall, ID station, 2026 included; the last time before 2026 was 2025.
At the McCall, ID station on 20 November: record high 56°F (1936), record low -1°F (1929).
- Normal range, 28.6 to 48°F
Every year as a table
Every 20 November low in McCall, ID since 1906: 27°F in 2026; the lowest is -1°F, in 1929.
| Year | High, °F | Low, °F |
|---|---|---|
| 2026 | 35 | 27 |
| 2025 | 42 | 36 |
| 2024 | 36 | 21 |
| 2023 | 40 | 17 |
| 2022 | 30 | 2 |
| 2021 | 38 | 23 |
| 2020 | 24 | 10 |
| 2019 | 45 | 26 |
| 2018 | 46 | 16 |
| 2017 | 39 | 29 |
| 2016 | 43 | 32 |
| 2015 | 28 | 5 |
| 2014 | 35 | 23 |
| 2013 | 37 | 20 |
| 2012 | 45 | 40 |
| 2011 | 27 | 3 |
| 2010 | 30 | 20 |
| 2009 | 44 | 22 |
| 2008 | 51 | 25 |
| 2007 | 29 | 14 |
| 2006 | 45 | 34 |
| 2005 | 33 | 14 |
| 2004 | 33 | 16 |
| 2003 | 31 | 13 |
| 2002 | 51 | 27 |
| 2001 | 46 | 32 |
| 2000 | 29 | 9 |
| 1998 | 33 | 28 |
| 1997 | 30 | |
| 1996 | 45 | 24 |
| 1995 | 54 | 26 |
| 1994 | 6 | |
| 1993 | 42 | 12 |
| 1992 | 33 | 19 |
| 1991 | 36 | 24 |
| 1990 | 39 | 21 |
| 1989 | 53 | 25 |
| 1988 | 34 | 20 |
| 1987 | 46 | 20 |
| 1986 | 45 | 27 |
| 1985 | 22 | 14 |
| 1984 | 36 | 30 |
| 1983 | 35 | 21 |
| 1982 | 32 | 20 |
| 1981 | 37 | 30 |
| 1980 | 40 | 16 |
| 1979 | 33 | 7 |
| 1978 | 39 | 29 |
| 1977 | 18 | 6 |
| 1976 | 52 | 22 |
| 1975 | 33 | 11 |
| 1974 | 50 | 30 |
| 1973 | 30 | 17 |
| 1972 | 42 | 14 |
| 1971 | 50 | 34 |
| 1970 | 35 | 29 |
| 1969 | 48 | 18 |
| 1968 | 35 | 31 |
| 1967 | 48 | 36 |
| 1966 | 50 | 38 |
| 1965 | 43 | 26 |
| 1964 | 36 | 12 |
| 1963 | 32 | 22 |
| 1962 | 48 | 34 |
| 1961 | 30 | 20 |
| 1960 | 33 | 28 |
| 1959 | 38 | 24 |
| 1958 | 50 | 36 |
| 1957 | 35 | 5 |
| 1956 | 37 | 10 |
| 1955 | 39 | 32 |
| 1954 | 48 | 25 |
| 1953 | 36 | 24 |
| 1952 | 36 | 20 |
| 1951 | 38 | 30 |
| 1950 | 36 | 20 |
| 1949 | 46 | 17 |
| 1948 | 26 | |
| 1947 | 32 | 3 |
| 1946 | 35 | 23 |
| 1945 | 32 | 13 |
| 1944 | 24 | 18 |
| 1943 | 45 | 31 |
| 1942 | 37 | 2 |
| 1941 | 32 | 11 |
| 1940 | 31 | 11 |
| 1939 | 51 | 16 |
| 1937 | 38 | 33 |
| 1936 | 56 | 17 |
| 1935 | 36 | 15 |
| 1934 | 32 | 28 |
| 1933 | 47 | 16 |
| 1931 | 30 | 11 |
| 1930 | 33 | 14 |
| 1929 | 30 | -1 |
| 1928 | 46 | 22 |
| 1926 | 41 | 33 |
| 1925 | 44 | 13 |
| 1924 | 37 | 34 |
| 1923 | 44 | 31 |
| 1922 | 39 | 15 |
| 1921 | 34 | 27 |
| 1920 | 40 | 31 |
| 1919 | 38 | 22 |
| 1918 | 42 | 12 |
| 1917 | 50 | 23 |
| 1916 | 40 | 9 |
| 1909 | 42 | 26 |
| 1908 | 49 | 39 |
| 1907 | 31 | 26 |
| 1906 | 26 | 18 |
The forecast
So far on Saturday 21 November 2026: a high of 30°F and a low of 26°F in McCall, ID, with 0.00 in of precipitation (the National Weather Service report as of 10:00 AM local time).
| Date | High | Low |
|---|---|---|
| 32°FRecord 60°F, 1936 | 25°FRecord -6°F, 1945 | |
| Record 56°F, 1954 | Record -6°F, 1994 |
The month and the year
Every year's 1 to 20 November in McCall, ID, ranked by its mean temperature: November 2026 so far is the 10th warmest of 88.
Every year, ranked, as a table
| Rank | Year | Mean, °F |
|---|---|---|
| 1 | 2025 | 41 |
| 2 | 2016 | 40.5 |
| 3 | 1965 | 40.2 |
| 4 | 1976 | 39.5 |
| 5 | 1967 | 39.2 |
| 6 | 1917 | 38.7 |
| 7 | 1981 | 38.6 |
| 7 | 1954 | 38.6 |
| 9 | 1962 | 37.8 |
| 10 | 2026 | 37.6 |
| 11 | 1908 | 37.5 |
| 12 | 1966 | 37.2 |
| 13 | 2001 | 37.1 |
| 13 | 1983 | 37.1 |
| 13 | 1949 | 37.1 |
| 16 | 1941 | 36.9 |
| 17 | 2019 | 36.4 |
| 17 | 1989 | 36.4 |
| 19 | 1953 | 36.3 |
| 20 | 2023 | 36.2 |
| 20 | 1972 | 36.2 |
| 22 | 2021 | 36 |
| 23 | 2008 | 35.7 |
| 23 | 1987 | 35.7 |
| 23 | 1980 | 35.7 |
| 26 | 2010 | 35.6 |
| 26 | 1974 | 35.6 |
| 26 | 1969 | 35.6 |
| 29 | 1921 | 35.5 |
| 30 | 1996 | 34.9 |
| 31 | 1963 | 34.7 |
| 32 | 1997 | 34.5 |
| 32 | 1970 | 34.5 |
| 34 | 2012 | 34.2 |
| 35 | 2007 | 34.1 |
| 36 | 1990 | 33.9 |
| 36 | 1943 | 33.9 |
| 38 | 1958 | 33.5 |
| 39 | 2006 | 33.3 |
| 39 | 2004 | 33.3 |
| 41 | 1918 | 33.1 |
| 42 | 2020 | 33 |
| 42 | 1975 | 33 |
| 44 | 1988 | 32.9 |
| 44 | 1960 | 32.9 |
| 46 | 1992 | 32.8 |
| 47 | 2013 | 32.7 |
| 48 | 1950 | 32.5 |
| 49 | 1979 | 32.3 |
| 49 | 1973 | 32.3 |
| 51 | 1978 | 32.1 |
| 52 | 1968 | 32 |
| 52 | 1952 | 32 |
| 54 | 1964 | 31.9 |
| 55 | 1984 | 31.6 |
| 55 | 1959 | 31.6 |
| 57 | 2018 | 31.5 |
| 57 | 1977 | 31.5 |
| 59 | 1986 | 31.4 |
| 60 | 2009 | 31.3 |
| 60 | 1944 | 31.3 |
| 62 | 2015 | 31.2 |
| 63 | 1971 | 30.8 |
| 64 | 1957 | 30.7 |
| 65 | 1920 | 30.4 |
| 66 | 1998 | 30.3 |
| 67 | 2002 | 30.1 |
| 67 | 1982 | 30.1 |
| 69 | 2024 | 29.9 |
| 69 | 1951 | 29.9 |
| 71 | 2017 | 29.7 |
| 72 | 1948 | 29.3 |
| 73 | 1919 | 28.9 |
| 74 | 1946 | 28.7 |
| 75 | 1956 | 28.5 |
| 76 | 1994 | 28.2 |
| 77 | 1947 | 28.1 |
| 78 | 1985 | 27.9 |
| 79 | 1961 | 27.6 |
| 79 | 1916 | 27.6 |
| 79 | 1909 | 27.6 |
| 82 | 2014 | 27.2 |
| 83 | 2005 | 27.1 |
| 84 | 2003 | 26.9 |
| 85 | 2011 | 26.1 |
| 86 | 1955 | 24.3 |
| 87 | 2022 | 24.2 |
| 88 | 2000 | 20.9 |
Every day as a table
Daily highs and lows in McCall, ID, 1 to 20 November 2026, with each date's record range and its 1991 to 2020 normal range.
| Day | High, °F | Low, °F | Record high | Year | Record low | Year | Normal high | Normal low |
|---|---|---|---|---|---|---|---|---|
| 44 | 36 | 68 | 1988 | 2 | 2006 | 45 | 23.2 | |
| 49 | 26 | 66 | 1962 | 4 | 2002 | 45.2 | 22.5 | |
| 46 | 27 | 64 | 2020 | 2 | 1936 | 44.9 | 23 | |
| 51 | 25 | 64 | 1980 | -2 | 2003 | 44.7 | 22.5 | |
| 49 | 26 | 65 | 1980 | -3 | 2003 | 44.2 | 22.5 | |
| 45 | 24 | 62 | 1999 | 2 | 2003 | 45.6 | 25 | |
| 57 | 25 | 63 | 1999 | 1 | 2017 | 44.8 | 23.7 | |
| 51 | 32 | 63 | 2016 | 4 | 1994 | 43.7 | 23 | |
| 54 | 28 | 63 | 2016 | 2 | 1986 | 42.9 | 22.8 | |
| 54 | 32 | 63 | 2016 | -4 | 1986 | 41.9 | 22.8 | |
| 60 | 28 | 62 | 2016 | 2 | 2000 | 39.8 | 20.4 | |
| 59 | 26 | 63 | 1999 | -5 | 1938 | 40.3 | 21.5 | |
| 57 | 26 | 61 | 1999 | -7 | 1916 | 40.3 | 22.7 | |
| 43 | 31 | 59 | 1999 | 1 | 1916 | 40.4 | 20.6 | |
| 48 | 29 | 55 | 1943 | -13 | 1955 | 40 | 19.9 | |
| 40 | 32 | 57 | 1934 | -14 | 1955 | 41.1 | 21.8 | |
| 33 | 28 | 58 | 1908 | -4 | 1958 | 40.7 | 23.1 | |
| 32 | 22 | 54 | 2008 | 1 | 2022 | 39.2 | 21.2 | |
| 35 | 30 | 57 | 1936 | -4 | 1985 | 38.7 | 21.1 | |
| 35 | 27 | 56 | 1936 | -1 | 1929 | 38.3 | 20.7 |
The warmest, coldest and wettest on this date
| Rank | Year | High, °F |
|---|---|---|
| 1 | 1936 | 56 |
| 2 | 1995 | 54 |
| 3 | 1989 | 53 |
| 4 | 1976 | 52 |
| 5 | 2008 | 51 |
| 5 | 2002 | 51 |
| 5 | 1939 | 51 |
| 8 | 1974 | 50 |
| 8 | 1971 | 50 |
| 8 | 1966 | 50 |
| 8 | 1958 | 50 |
| 8 | 1917 | 50 |
| 13 | 1908 | 49 |
| 14 | 1969 | 48 |
| 14 | 1967 | 48 |
| 14 | 1962 | 48 |
| 14 | 1954 | 48 |
| 18 | 1933 | 47 |
| 19 | 2018 | 46 |
| 19 | 2001 | 46 |
| Rank | Year | Low, °F |
|---|---|---|
| 1 | 1929 | -1 |
| 2 | 2022 | 2 |
| 2 | 1942 | 2 |
| 4 | 2011 | 3 |
| 4 | 1947 | 3 |
| 6 | 2015 | 5 |
| 6 | 1957 | 5 |
| 8 | 1994 | 6 |
| 8 | 1977 | 6 |
| 10 | 1979 | 7 |
| 11 | 2000 | 9 |
| 11 | 1916 | 9 |
| 13 | 2020 | 10 |
| 13 | 1956 | 10 |
| 15 | 1975 | 11 |
| 15 | 1941 | 11 |
| 15 | 1940 | 11 |
| 15 | 1931 | 11 |
| 19 | 1993 | 12 |
| 19 | 1964 | 12 |
| Rank | Year | Precipitation, in |
|---|---|---|
| 1 | 1946 | 1.15 |
| 2 | 1926 | 1.08 |
| 3 | 1937 | 0.75 |
| 4 | 1996 | 0.70 |
| 5 | 1924 | 0.59 |
| 6 | 1905 | 0.52 |
| 7 | 1955 | 0.50 |
| 8 | 1963 | 0.46 |
| 9 | 2012 | 0.44 |
| 10 | 1991 | 0.36 |
| 11 | 1921 | 0.35 |
| 12 | 2017 | 0.33 |
| 13 | 2024 | 0.30 |
| 13 | 1984 | 0.30 |
| 15 | 2013 | 0.28 |
| 15 | 2001 | 0.28 |
| 15 | 1997 | 0.28 |
| 18 | 1973 | 0.26 |
| 19 | 1966 | 0.25 |
| 19 | 1951 | 0.25 |
Every answer in words
- Friday 20 November 2026: a high of 35°F in McCall, ID, the coldest 20 November day since 2022, tied 35th coldest of 108 (with 2014, 1983, 1970 and 3 other years).
- Friday 20 November 2026: a low of 27°F in McCall, ID, the warmest 20 November night since 2025, tied 31st warmest of 111 (with 2002, 1986 and 1921).
- Forecast for Saturday 21 November 2026: a high of 32°F in McCall, ID, which would be the coldest 21 November day since 2020, tied 22nd coldest of 110 (with 1982, 1963, 1955 and 1 other year) (National Weather Service forecast).
- Forecast for Saturday 21 November 2026: a low of 25°F in McCall, ID, which would be the warmest 21 November night since 2025, tied 32nd warmest of 109 (with 2002, 1995, 1987 and 2 other years) (National Weather Service forecast).
- McCall, ID on 21 November: record high 60°F (1936), record low -6°F (1945).
- McCall, ID on 22 November: record high 56°F (1954), record low -6°F (1994).
- November 2026 so far averaged 37.6°F in McCall, ID, the warmest 1 to 20 November since 2025, 10th warmest of 88.
- November 2026 so far brought 1.76 in of precipitation in McCall, ID, the wettest 1 to 20 November since 2024, 45th wettest of 102.
- Fall 2026 so far averaged 46.8°F in McCall, ID, the warmest 1 September to 20 November since 2025, 7th warmest of 87.
- Fall 2026 so far brought 4.22 in of precipitation in McCall, ID, the driest 1 September to 20 November since 2022, 39th driest of 98.
- 2026 so far averaged 46.5°F in McCall, ID, the warmest 1 January to 20 November since 2015, 3rd warmest of 83.
- The 30 days to Friday 20 November 2026 brought 2.54 in of precipitation in McCall, ID, the driest 30 days to 20 November since 2020, 54th driest of 99.
- The 60 days to Friday 20 November 2026 brought 2.67 in of precipitation in McCall, ID, the driest 60 days to 20 November since 2019, 23rd driest of 99.
- The 90 days to Friday 20 November 2026 brought 4.22 in of precipitation in McCall, ID, the driest 90 days to 20 November since 2022, 36th driest of 98.
- McCall, ID has had 10 days at 90°F or above in 2026 through 20 November, the most by that date since 2024, tied 11th most of 85 (with 2012, 1992, 1990 and 1 other year).
- McCall, ID has had 160 freezing nights (a low of 32°F or below) in 2026 through 20 November, the most by that date since 2024, tied 80th most of 87 (with 2023).
- The first freeze of fall 2026 in McCall, ID came on Tuesday 15 September 2026, the earliest since 2021, tied 86th earliest of 96 (with 1940).
- The last freeze of spring 2026 in McCall, ID came on Thursday 11 June 2026, the latest since 2025, 79th latest of 91.
McCall, ID had 160 freezing nights (a low of 32°F or below) from 1 January to 20 November 2026; the 1991 to 2020 average for those days is 182 (between 163 and 205 in eight years of ten).
The last freeze of spring 2026 in McCall, ID was on 11 June; the typical last freeze of spring (1991 to 2020) is 20 June, with eight years in ten between 11 June and 4 July.
The first freeze of fall 2026 in McCall, ID was on 15 September; the typical first freeze of fall (1991 to 2020) is 2 September, with eight years in ten between 21 August and 16 September.
Weather records in McCall

How is the year so far comparing with normal?
2026 so far · to
46.5°F
Mean temperature
Warmest since 2015
3rd warmest of 83
16.03 in Precipitation
November 2026 so far · to
37.6°F
Mean temperature
Warmest since 2025
10th warmest of 88
1.76 in Precipitation
Months, seasons and years
Months
Seasons
Years
Explore more of Idaho
Ontario, OR
75.5 mi
Stanley, ID
76.4 mi
Baker City, OR
83.8 mi
Boise, ID
92.0 mi

Challis, ID
96.0 mi
Valley County, ID
county average
Idaho
every city and county
About these figures
Daily records for McCall, ID run from 1905 to 20 November 2026, with 4532 days missing; current station MCCALL AP.
Our calculation from NOAA records for McCall, ID, 1905 to 2026. Preliminary until NOAA's final data.