Your weather. With history.
Daily weather, monthly averages and records
for US cities and counties.
Friday : a low of 58°F in Riverside, CA, the warmest 13 November night on record, in 124 years since 1893 (no value for 1896, 1897, 1898 and 7 other years); matching the National Weather Service report.
Start with a place.
Explore weather, monthly averages and records for popular cities.
What is the weather usually like?
Explore typical temperatures and rainfall, month by month.
Recent daily extremes
How unusual was the weather?
Same calendar day. A longer perspective.
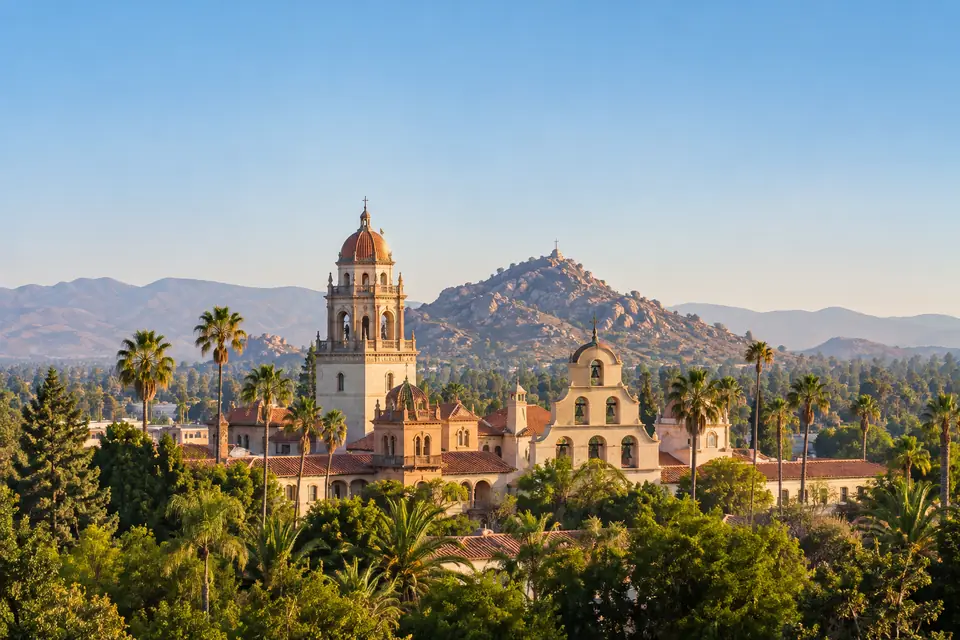
Riverside, CA
58°F Nighttime low
Warmest 13 November night on record
Same-date station record · Confirmed
Explore Riverside’s day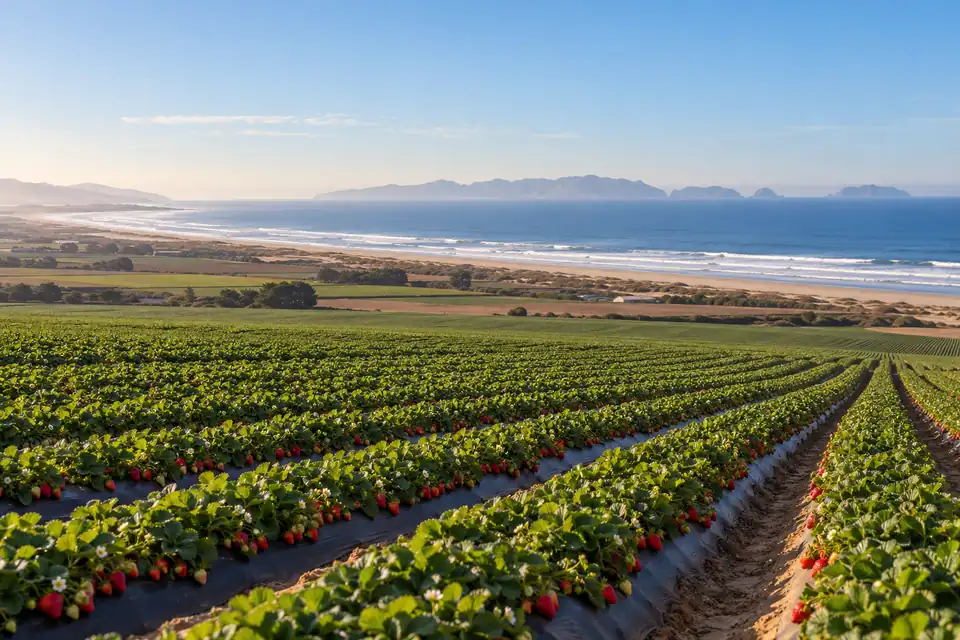
Oxnard, CA
1.06 in Precipitation
Wettest 13 November on record
Same-date station record · Provisional
Explore Oxnard’s day
St Paul Island, AK
12°F Nighttime low
Coldest 13 November night since 1918
108 years since comparable weather
Explore St Paul Island’s day
· Calculated from NOAA records · Recent values preliminary.Explore daily records
The month so far, in perspective.
364 of 366
US cities are warmer than their normal.
Compared with each city's own climate normal for these dates. Preliminary.
Explore
How is your year shaping up?
Compare temperatures, rainfall and heat days for your city.
Explore the year so farFind your corner of the country.
Search for a city or browse by state.
Every day has a backstory.
A familiar place can still surprise you. Explore the dates, the patterns and the weather people remember.
- A date worth remembering
- A trip worth planning
- A changing local climate
A few useful answers.
Can I see how a day compares with past years?
Yes. Find a city and its page ranks the latest complete day against the same date in every year of its record. Its month and year pages rank the month and the year the same way.
What do monthly averages mean?
They describe a typical full month, using the standard thirty-year period of NOAA's climate normals. The month so far has its own page, ranked against the same month of every earlier year.
How are records checked?
We compare the same calendar date or period in a place's available record. Missing observations and preliminary values remain identified.
Riverside, CA the day's answers
The month so far
November 2026 so far: 364 of 366 US cities are running warmer than their own 1991 to 2020 normal.
Also notable
| Place | Answer | Since | Gap, as a bar |
|---|---|---|---|
| Oxnard, CA | Wettest day | Record | |
| Ramona, CA | Wettest day | Record | |
| St Paul Island, AK | Coldest night | 108 years | |
| San Diego, CA | Wettest day | 76 years | |
| Los Angeles Airport, CA | Wettest day | 76 years | |
| Long Beach, CA | Warmest night | 57 years | |
| Bettles, AK | Warmest night | 50 years | |
| Bakersfield, CA | Wettest day | 48 years | |
| Kingman, AZ | Wettest day | 48 years | |
| Hanford, CA | Wettest day | 45 years | |
| Belvidere, NJ | Wettest day | 44 years |
Records
| Place | Record | Value | Before | Check |
|---|---|---|---|---|
| Riverside, CA | Warmest night | 58°F | 57°F 2014, 1983 | Confirmed |
| Oxnard, CA | Wettest day | 1.06 in | 0.74 in 1944 | Provisional |
| Ramona, CA | Wettest day | 0.18 in | 0.10 in 1984 | Confirmed |
The day in words
- Friday 13 November 2026: 1.06 in of precipitation in Oxnard, CA, the wettest 13 November on record, in 103 years since 1924; provisional.
- Friday 13 November 2026: 0.18 in of precipitation in Ramona, CA, the wettest 13 November on record, in 51 years since 1974 (no value for 1983 and 1997); matching the National Weather Service report.
- Friday 13 November 2026: a low of 12°F in St Paul Island, AK, the coldest 13 November night since 1918 (no value for 1942 and 2019), 2nd coldest of 112.
- Friday 13 November 2026: 0.66 in of precipitation in San Diego, CA, the wettest 13 November since 1950, 4th wettest of 173.
- Friday 13 November 2026: 0.53 in of precipitation in Los Angeles Airport, CA, the wettest 13 November since 1950, 4th wettest of 83.
- Friday 13 November 2026: a low of 60°F in Long Beach, CA, the warmest 13 November night since 1969, 2nd warmest of 69.
- Friday 13 November 2026: a low of 20°F in Bettles, AK, the warmest 13 November night since 1976, 3rd warmest of 83.
- Friday 13 November 2026: 0.12 in of precipitation in Bakersfield, CA, the wettest 13 November since 1978, tied 4th wettest of 120 (with 1978).
- Friday 13 November 2026: 0.08 in of precipitation in Kingman, AZ, the wettest 13 November since 1978 (no value for 1993, 1994, 1995 and 2 other years), tied 4th wettest of 119 (with 1946).
- Friday 13 November 2026: 0.12 in of precipitation in Hanford, CA, the wettest 13 November since 1981 (no value for 1984), tied 8th wettest of 106 (with 1965).
- Friday 13 November 2026: 0.90 in of precipitation in Belvidere, NJ, the wettest 13 November since 1982 (no value for 2006 and 2018), 8th wettest of 132.
- Friday 13 November 2026: 1.06 in of precipitation in Oxnard, CA, the wettest 13 November on record, in 103 years since 1924; provisional.
- Friday 13 November 2026: 0.18 in of precipitation in Ramona, CA, the wettest 13 November on record, in 51 years since 1974 (no value for 1983 and 1997); matching the National Weather Service report.
The wire every record and notable answer, a line each
Every state
- Alabama
- Alaska
- Arizona
- Arkansas
- California
- Colorado
- Connecticut
- Delaware
- District of Columbia
- Florida
- Georgia
- Hawaii
- Idaho
- Illinois
- Indiana
- Iowa
- Kansas
- Kentucky
- Louisiana
- Maine
- Maryland
- Massachusetts
- Michigan
- Minnesota
- Mississippi
- Missouri
- Montana
- Nebraska
- Nevada
- New Hampshire
- New Jersey
- New Mexico
- New York
- North Carolina
- North Dakota
- Ohio
- Oklahoma
- Oregon
- Pennsylvania
- Rhode Island
- South Carolina
- South Dakota
- Tennessee
- Texas
- Utah
- Vermont
- Virginia
- Washington
- West Virginia
- Wisconsin
- Wyoming
The places with the longest records
- Newark, NJ
- San Diego, CA
- Sacramento, CA
- Vancouver, WA
- Athens, GA
- Reading, PA
- Lansing, MI
- Trenton, NJ
- Concord, NH
- Asheville, NC
- Madison, WI
- New York, NY
- Augusta, GA
- Baltimore, MD
- Buffalo, NY
- Cheyenne, WY
- Chicago, IL
- Cincinnati, OH
- Cleveland, OH
- Duluth, MN
- Galveston, TX
- Indianapolis, IN
- Jacksonville, FL
- Key West, FL
- Knoxville, TN
- Milwaukee, WI
- Minneapolis-St Paul, MN
- Mobile, AL
- Moline, IL
- Nashville, TN
- Omaha, NE
- Philadelphia, PA
- Pittsburgh, PA
- Portland, ME
- Rochester, NY
- Savannah, GA
- Shreveport, LA
- Toledo, OH
- Washington, DC
- Wilmington, NC
- Boston, MA
- Denver, CO
- La Crosse, WI
- Lexington, KY
- Louisville, KY
- Memphis, TN
- Montgomery, AL
- Morgantown, WV
- Mount Ida, AR
- Portland Downtown, OR
How we know
- Every answer is our own calculation from public NOAA records: each city's threaded daily record and each county's gridded average.
- A record waits for the National Weather Service's daily report, and a value that looks wrong is held for a person to check before any page uses it.
- Recent values are preliminary until NOAA's final data, and a page says so.